Bitcoin Network Momentum (BNM) Explained [Simply]
It’s been a while that I have written anything on Bitcoin’s on-chain indicators. Last time when you were here I have written about Bitcoin NVT ration & Bitcoin NVT Signal.
This time I am tempted to write on Bitcoin Network Momentum (BNM) because the time is ripe for you to know about this on-chain indicator to develop your strategies.
BNM just like Bitcoin NVT or Bitcoin NVTS is good indicators to keep in mind while you decide to sell or buy Bitcoin. This type of on-chain indicator is our good fortune to analyze the state of Bitcoin correctly.
In the realm of stock or bonds markets, investors never have the opportunity to get their hands on such indicators. Whereas in open systems like Bitcoin general masses do have the opportunity.
So without further beating around the bush, let us see what this new indicator BNM is?
What Is Bitcoin Network Momentum (BNM)?
BNM, better known as Bitcoin Network Momentum, is one of the leading indicators for Bitcoin’s price during its market cycle.
Unlike Bitcoin NVT, BNM is more of an empirical thing which decently explains why Bitcoin’s price is at a particular point in a given cycle and where it is likely to head.
BNM takes into consideration the volume transacted on the Bitoicn’s blockchain in BTC terms and correlates it with price movements.
The resulting momentum of the price indicated by this correlation is known as Bitcoin network momentum because a sufficiently high level of the on-chain volume being transacted is required to begin a bull run.
How Is BNM Calculated?
As I told you BNM is not like Bitcoin NVT. It is not a ratio or a multiplier. It is an empirical observation which correlates Bitcoin’s price with the absolute volume being transacted on the blockchain in BTC.
Whereas in NVT uses the USD value of the transaction volume.
That’s why BNM has no formula to calculate it, but one can surely look at the charts and come to a conclusion about the net momentum of the Bitcoin’s price in correlation to the on chain volume.
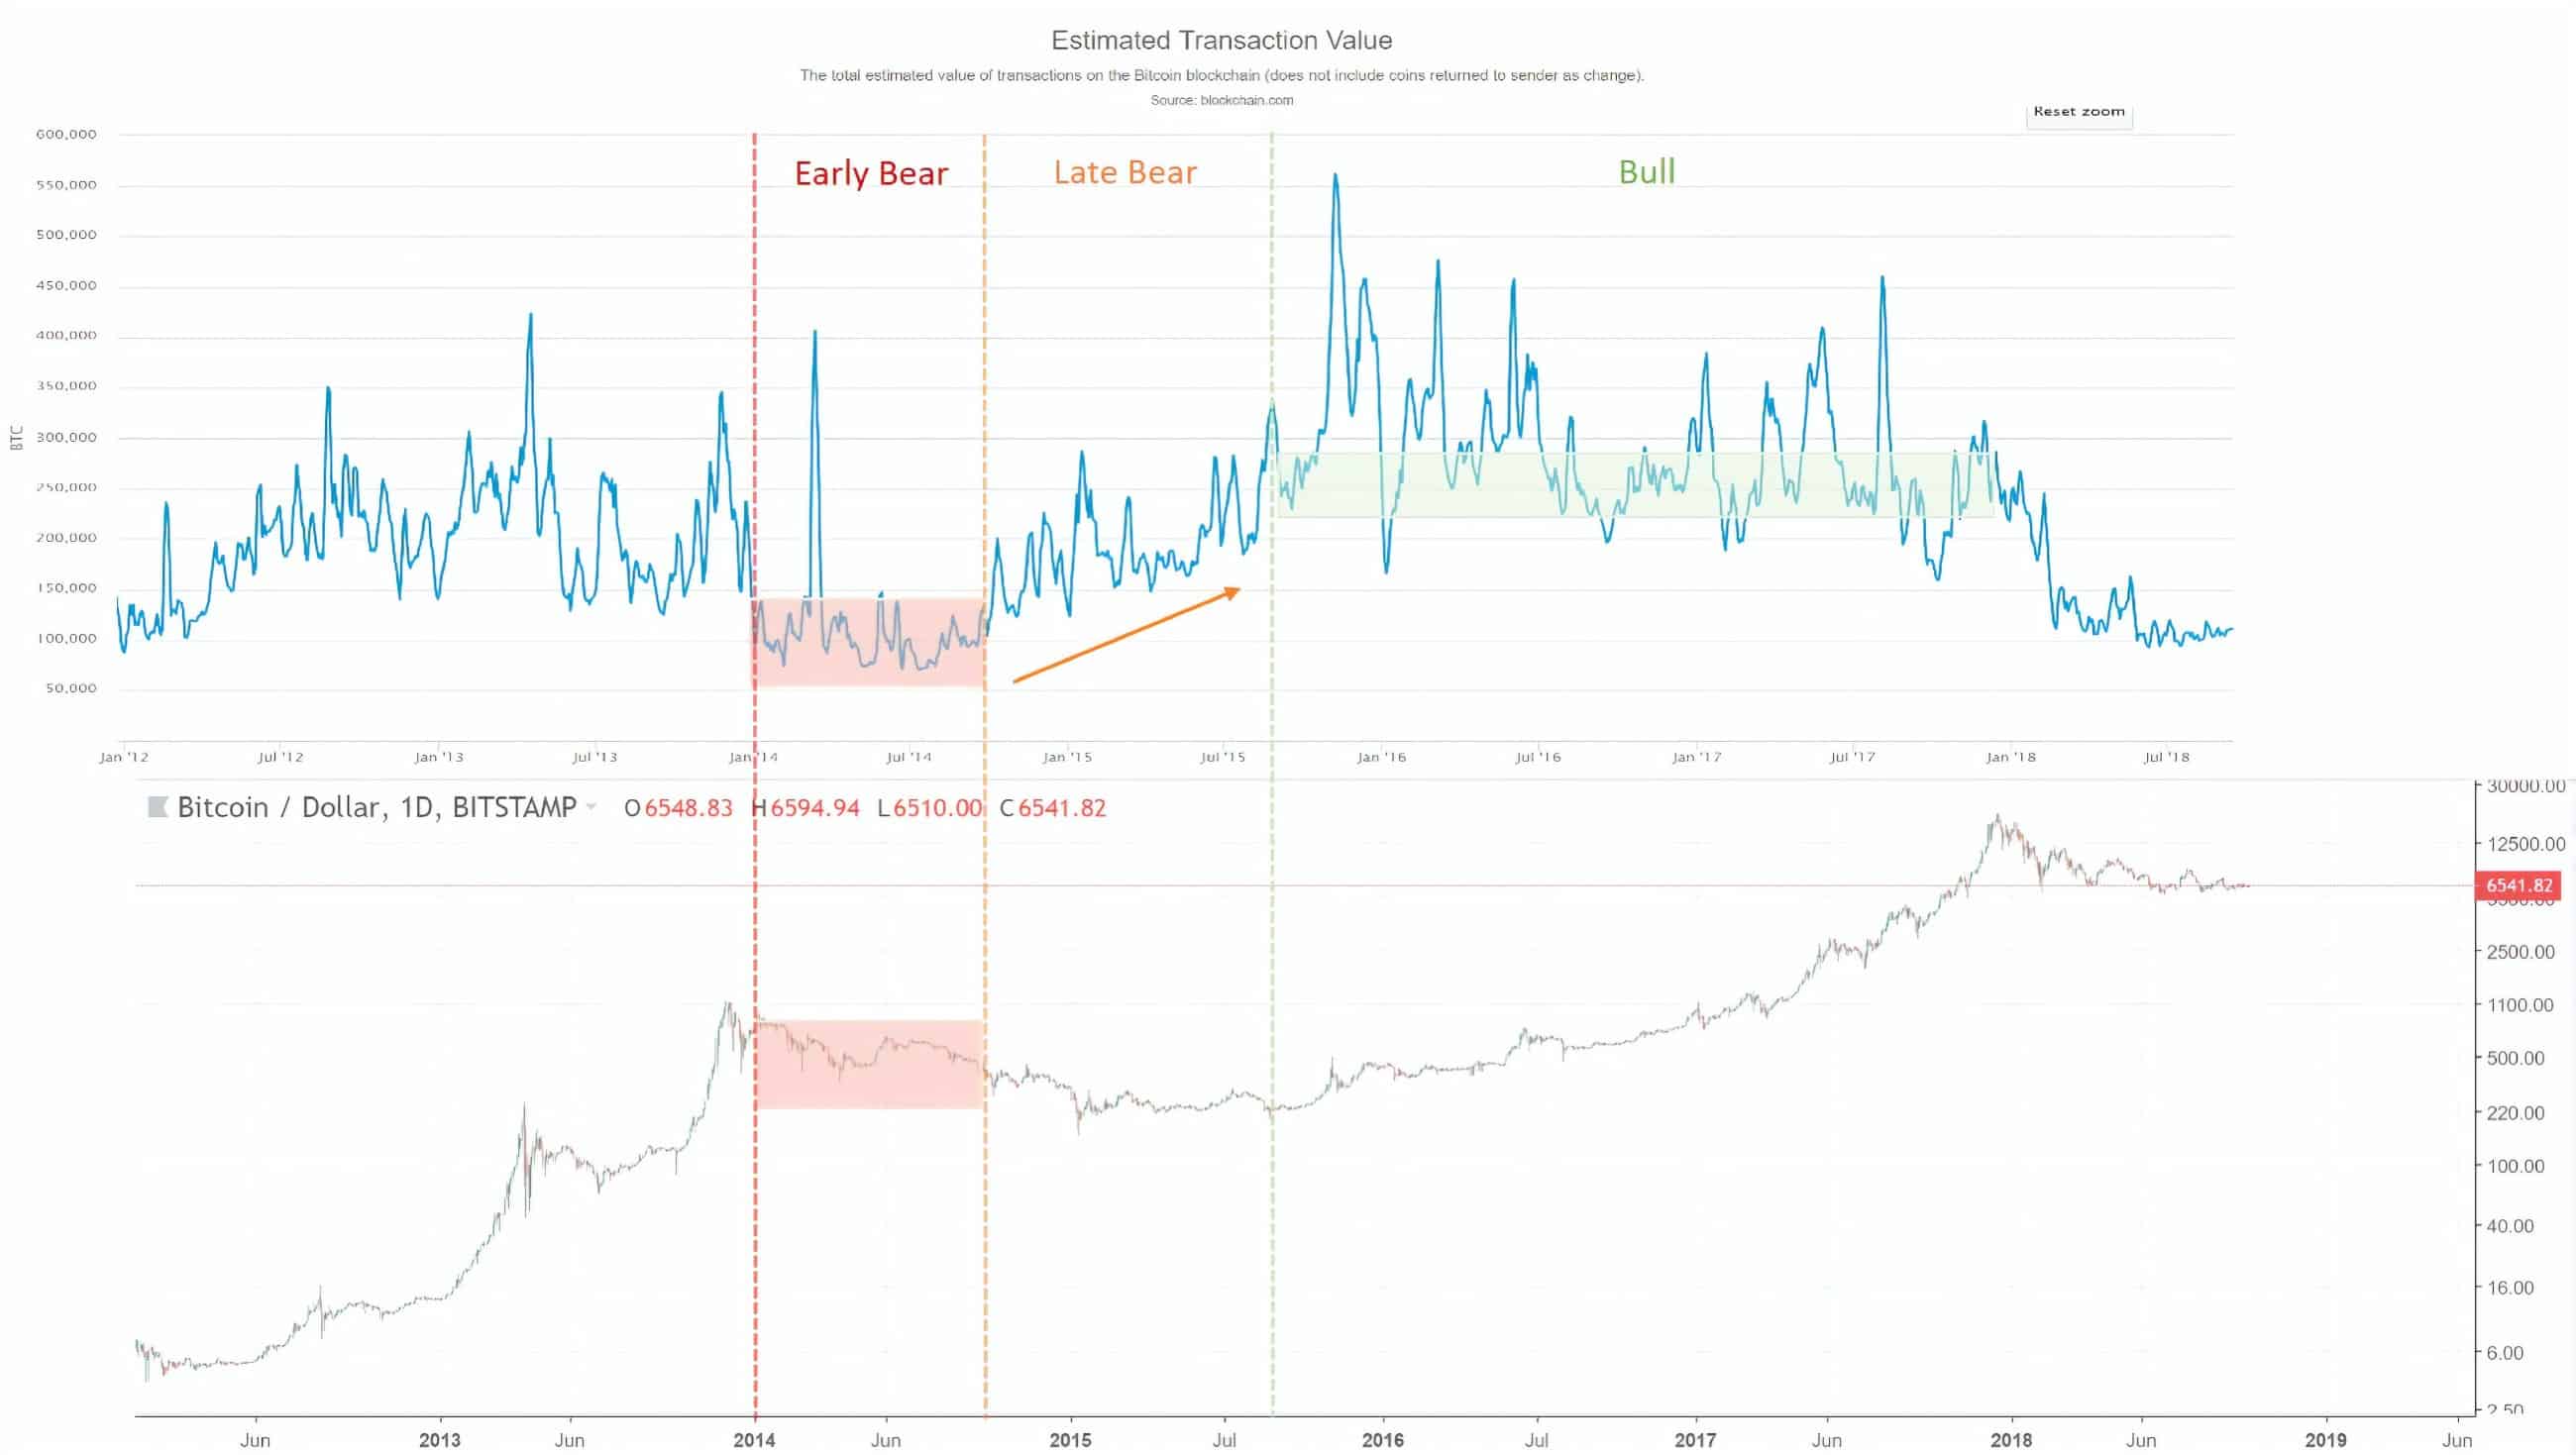
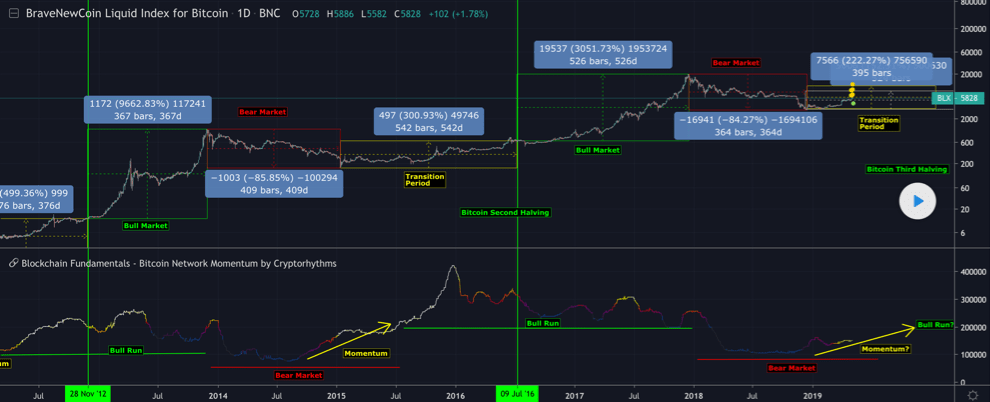
Look at this chart showing you how the momentum is perceived.
- In the early bear phase, daily transaction volume has dropped around 100k BTC a day which is kind of the last seen lowest in 2012. Accordingly, the prices are falling in 2014.
- In the late bear phase, daily transaction volume is increasing and as a result, price is mostly stable or moving sideways in this phase.
- In the bull phase in 2016-2017 now looking at it in retrospect, we can say that the transaction volume almost more than doubled around 250k. In this phase, the price keeps increasing. In the previous bull run, the higher limit of transaction volume reached to 150k.
Another thing to note here is that the level of transaction volume is higher in 2017 than the level in 2014. This is because of the increased number of coins in circulation, so this level has to be logically higher than the previous one to kick-off a bull run.
Who Proposed BNM?
Philip Swift first proposed Bitcoin network momentum in 2018, and it first appeared in a Tweetstorm and a detailed article explaining Bitcoin network momentum was published later in October 2018.
In my opinion, BNM is a much stronger indicator to look at for judging where the price is and where it is headed for. But if you combine it with NVT and NVTS, then a more robust picture of price movement and market cycle can be made.
Lastly, BNM purely breeds on human emotions and is mostly driven by short term Bitcoin investors and longer-term HODLers. But both of them are necessary to make market cycles of Bitcoin that we have seen so far.
Do share this article with friends who are interested in knowing about the market cycle and momentum of Bitcoin from BNM’s perspective !!
- Is Bitcoin Real Money?: Understanding Different Types Of Money - June 28, 2024
- Bitcoin Transaction Accelerator: 5 Services to Unstuck Your BTC - September 23, 2023
- What Is Bitcoin Private Key? Everything You Need To Know !! - June 2, 2023
Contents