Technical Analysis aims to estimate when you should take trades depending on the models that assume that the prices move according to patterns that repeat regularly.
It is used in crypto very much like it is used in legacy equity markets, with a few changes because the playing field has changed. For this reason, it is easy for an experienced trader to work in this market, and use their expertise to make profitable trades.
This article takes you through the indicators that were introduced and are widely used in the legacy markets but fare well with the largely volatile world of cryptocurrency trading.
Best Indicators For Crypto Day Trading
- Relative Strength Index (RSI)
- Bollinger Bands
- Moving Averages (MA)
- Moving Average Convergence/Divergence (MACD)
- Fibonacci Retracement
- Stochastic Oscillator
- Ichimoku Cloud
- On Balance Volume (OBV)
1. Relative Strength Index (RSI)
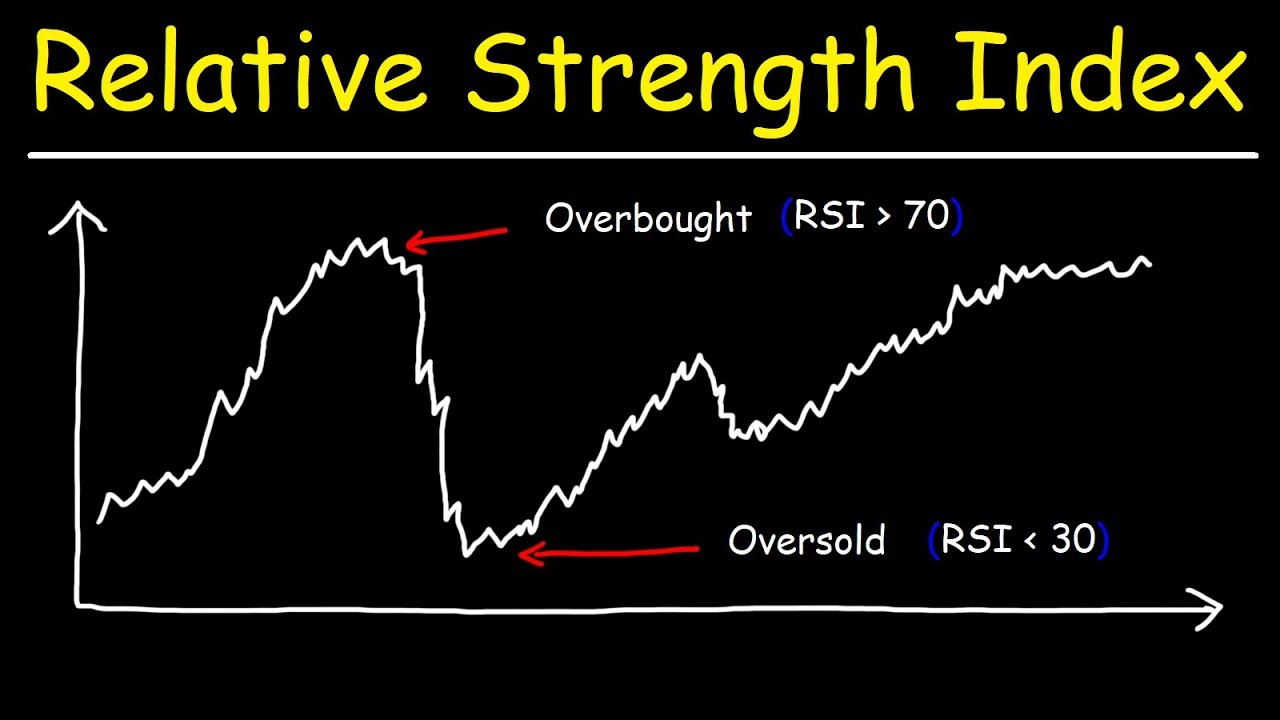
When it comes to indicators, this one is the most readily available and simple to grasp for new entrants. The Relative Strength Index (RSI) is a momentum indicator for the instrument you are looking to trade. It was developed in 1978 by a technical analyst by the name of Welles Wilder who opted to not name it after himself.
Using its formula, the Relative Strength Index gives a numerical value to the speed and magnitude of the price change. The result is a number between 0 and 100 where a value below 30 means that it is oversold and a value above 70 means that the asset is overbought and in both cases will eventually return to the mean value of 50.
A simple way to use this indicator is to buy when the value is about to exit the oversold zone (value is going from <30 to >30), or sell when the value is about to exit the overbought zone (going from >70 to <70).
You must be careful while using this indicator because as the value can be in overbought or oversold territories for a long time before returning to the mean.
Once it is set up on the chart, the price movements show up as a single sideways line between two horizontal lines that depict the oversold and overbought territories.
Most traders will use the Relative Strength Index in conjunction with others to decide if they want to remain in their positions or exit them. With this, you can also spot divergence signals for bullish or bearish price movement.
2. Bollinger Bands
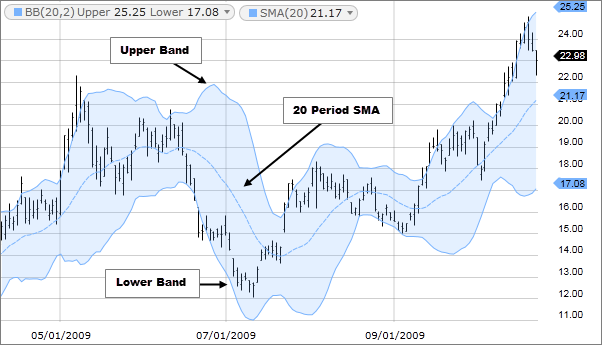
Bollinger Bands as a concept work to highlight how prices in crypto futures trading are distributed around an average value. Two other trendlines on either side of the average act as support and resistance levels and can be used to predict price movements.
The standard deviation used to calculate the position of the upper and lower band is a numerical value for the market’s volatility.
Default settings for this technical indicator will use the 20-day values for the standard deviation and draw the Simple moving average line which is the middle band.
When the price is close to the upper band, the market is said to be overbought and oversold when the price movement takes it toward the lower band. When the bands start to contract, the asset’s price is becoming less volatile, and more volatile if the bands begin to expand.
This oscillator measurer technical indicator was created in the 1980s by John Bollinger and is one of the first indicators used for technical analysis by a new trader.
Most traders use this lagging indicator to sell when the price is close to the upper band, and buy when it is close to the lower band. The narrowing of both these bands tells a trader that there is an upcoming consensus on the trading price which will be followed by a breakout to either side.
New to crypto trading? Know What is spread trading in crypto?
3. Moving Averages (MA)
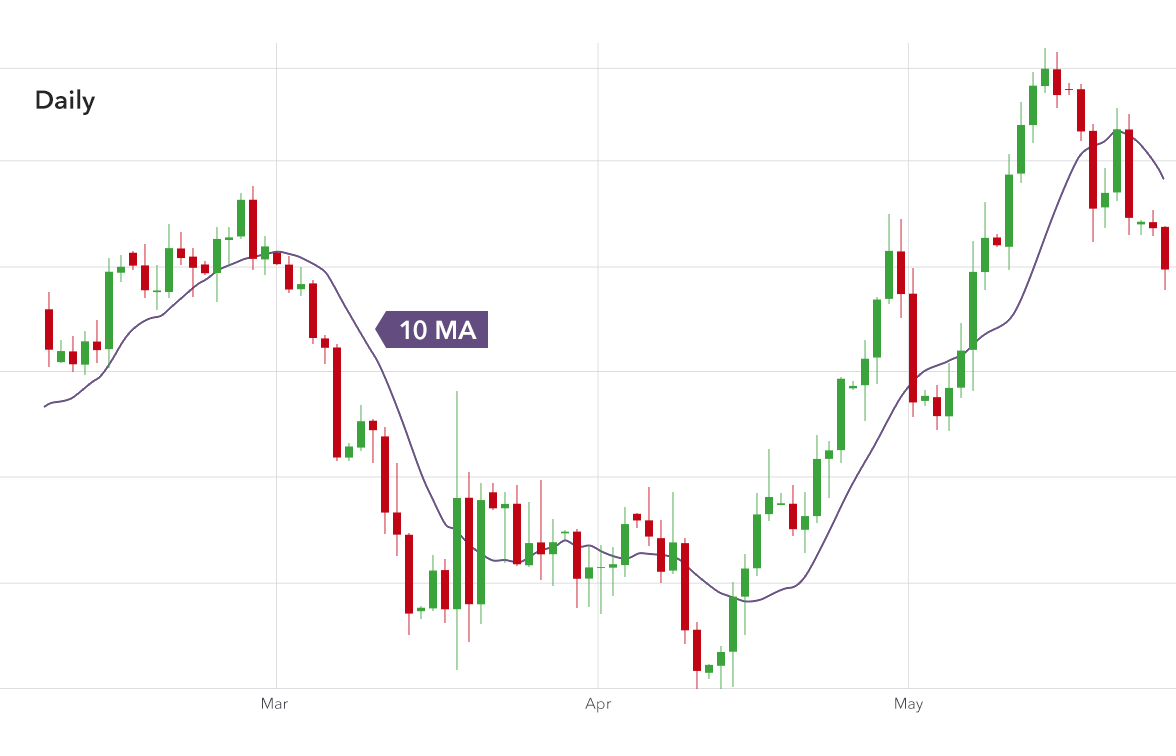
The moving averages are a lagging indicator and are used as a form of smoothing for price movements for a specific number of periods. This can help you build a trading strategy by finding future trends and predicting any price movements.
You can majorly categorize moving averages as simple and exponential. The Simple Moving Average (SMA) is useful to predict future trends over a longer time.
The Exponential Moving Average (EMA) is better suited to short-term traders as it prioritizes the current trend and gives more significance to the asset’s price in recent times.
A trader will use it as part of their technical analysis because the moving averages can act as support or resistance for the price. When your selected MA is sloping upwards, that is a bullish sign for your asset, and if it is sloped downwards, the asset’s price is primed for a fall.
You can feel free to experiment with what timeframe you want to use for your SMA, or Exponential Moving Average calculations but generally, 200, 50, and 20-period moving averages are used and this can help you gauge which direction to take on your next trade.
Major ways that professional traders use these SMAs are in the Golden and Death Cross indications. When the 50 SMA crosses the 200 SMA from up to down, it is called a Death Cross and may be indicative of an approaching bearish trend.
If the 50 SMA crosses the 200 SMA from down to up, it is referred to as a Golden Cross and could indicate that the asset is entering a bullish trend.
Other types of moving average indicators for crypto day trading are Smoothed Moving Average (SMMA), and Weighted Moving Average (WMA) indicators which are used by other crypto investors according to their specialized trading style.
Trading Futures in US? Know Why are many crypto futures exchanges banned in the US?
4. Moving Average Convergence/Divergence (MACD)
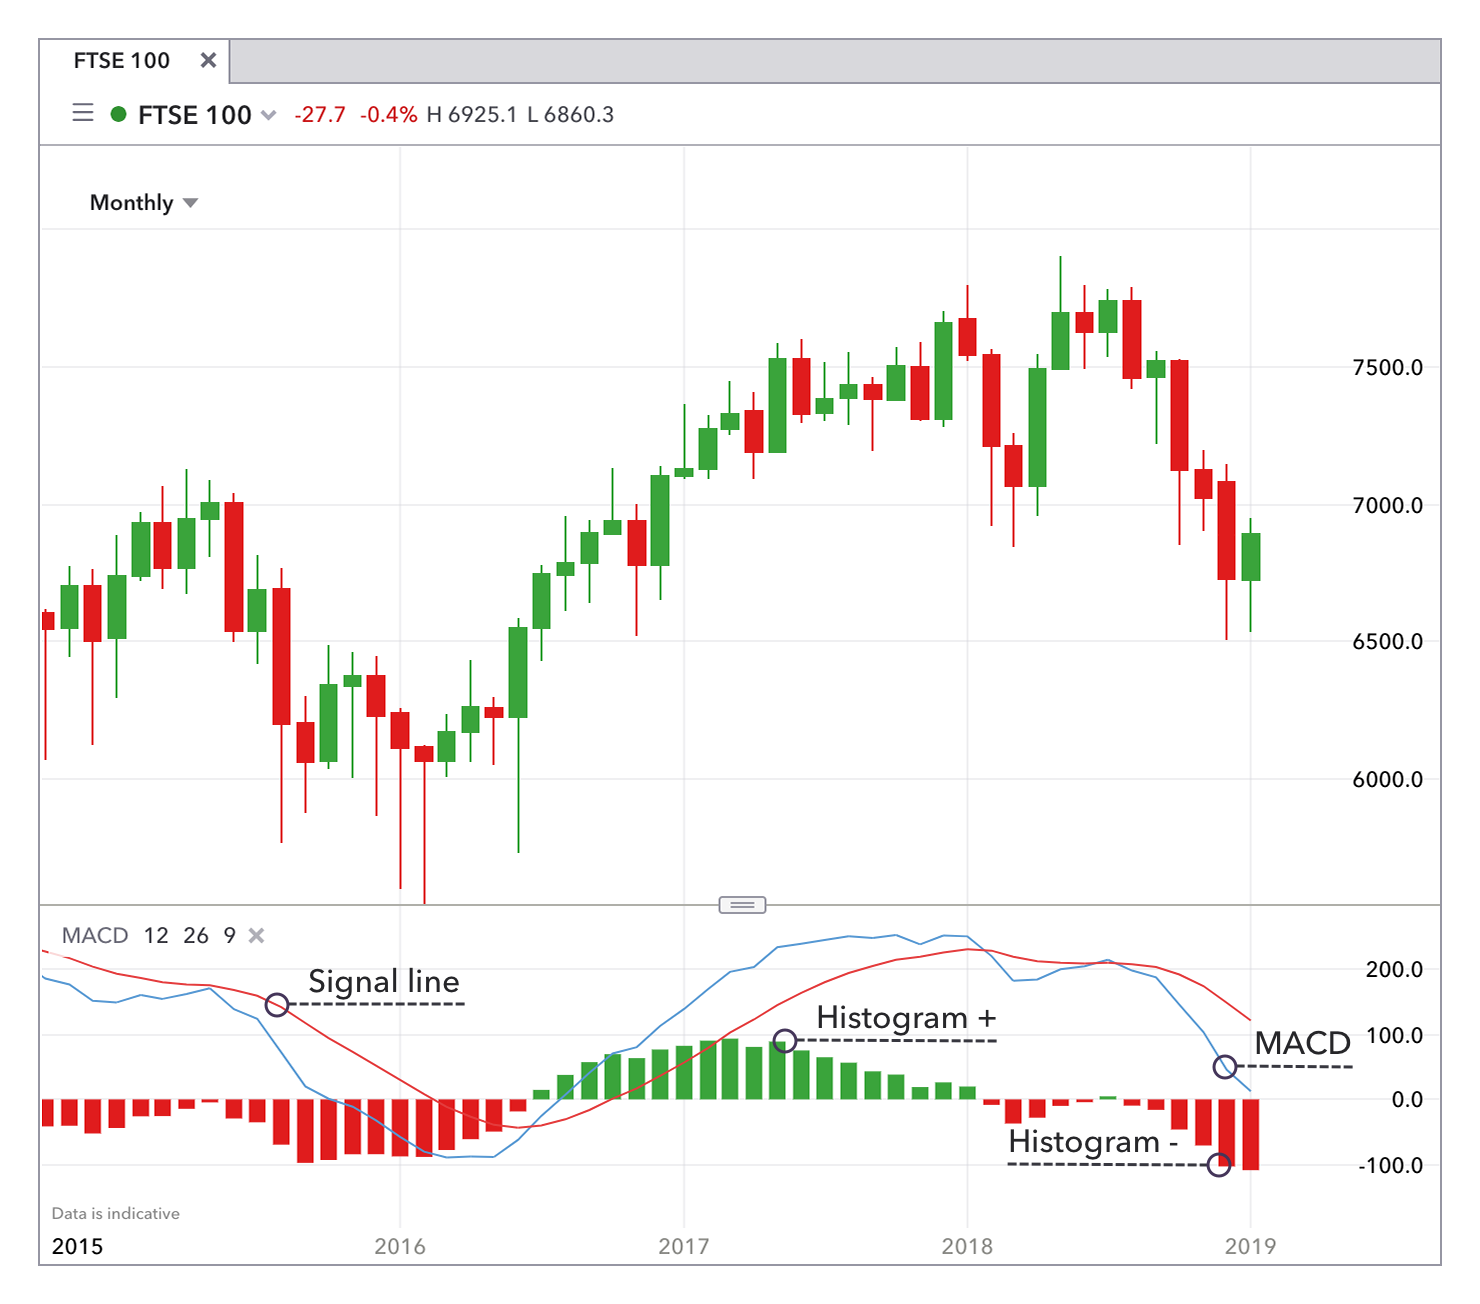
The MACD (Moving Average Convergence Divergence) indicator will show both the trend direction and the momentum of the asset price with the help of two moving average lines. When the lines are moving toward each other (converging) and the MACD crosses above the signal line, it is a sign of a bullish trend, and when the signal line crosses the MACD line, it is a bearish signal.
These crossovers tend to be frequent when the MACD and signal lines are close to each other so this can lead to a lot of false positives. For this reason, it makes sense to use the information from this moving average indicator along with other trading indicators to shore up your technical analysis.
The indicator has four elements, the MACD line, signal line, zero line, and histogram. The histogram displays the MACD line’s distance from the signal line and the value is positive when the MACD line is above the signal line, and negative when it is below it.
The MACD indicator does not have an absolute range unlike the RSI indicator so it cannot be used to determine whether the asset is overbought or oversold. The MACD line is constructed by subtracting the 26 EMA from the 12 EMA and EMA is used to increase the indicator’s sensitivity to short-term price data and market volatility.
The trading chart with MACD on it helps with spotting a bearish sign when the price is creating a higher high but the MACD line creates a lower high, or vice versa when the price makes a lower low, and the MACD line makes a higher high.
5. Fibonacci Retracement
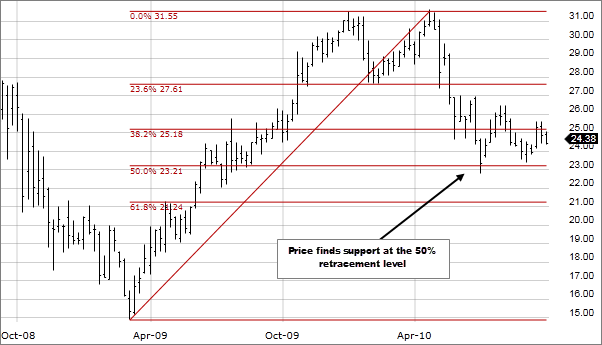
The Fibonacci retracement is one of the most used technical indicators and helps traders to identify the main horizontal levels to devise a trading strategy. The levels are 23.6%, 38.2%, 61.8%, and 78.6% and are devised from the famed Fibonacci sequence introduced by a mathematician from Italy in the 13th century.
For trading signals in the downward direction, place the 0 of the indicator at the range high, and the 1 at the range low. When you are looking for upside targets, the top and bottom of the Fibonacci indicator are to be placed at the range’s low and high respectively.
Just like most indicators for Bitcoin futures trading, this one is used along with others to analyze an asset’s price chart to determine the price reversal points. As a trader, you would expect the price to bounce off of these levels by way of trend analysis. In a bullish trend, any pullbacks will be expected to bounce off of these support levels and this is where you would enter into a trade.
Also when you see a lot of selling pressure and are in the market to look for shorting opportunities, your best bet is to enter at broken support on the retest. Once support is broken, it becomes resistance and you should ideally wait for a retest before entering your trade.
6. Stochastic Oscillator
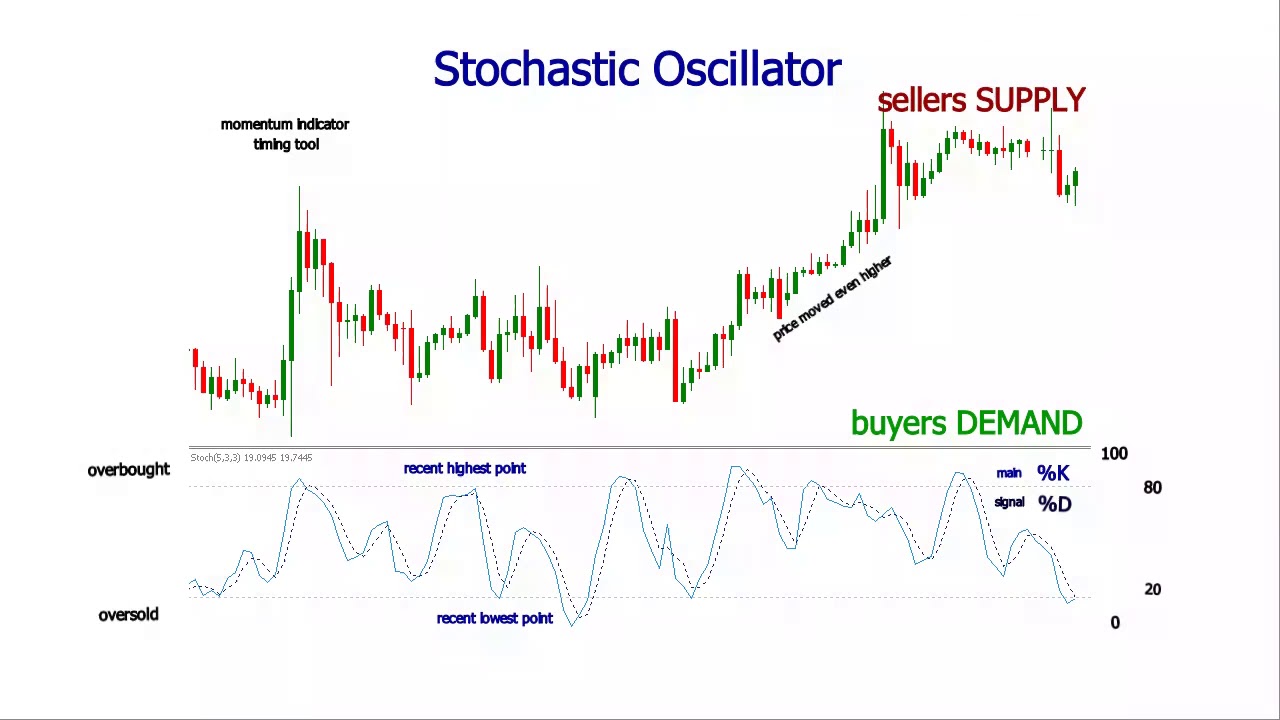
One of the few leading indicators on this list, it can help you determine the short-term price momentum of the price chart in question. The indicator compares the closing prices of the asset with its high and low prices in the selected period.
With the volatility in cryptocurrency trading, the Stochastic Oscillator works well regardless of this fast-paced market. The speed at which the trading indicators respond is dependent on the settings which can be achieved with experimentation.
The indicator is majorly made up of two lines, namely %K which is the ratio between the growth of the current closing price from the range low, and the difference between the range low and range high, and %D which is the 3-period simple moving average of %K.
Both %K and %D have a range of 0-100 and when the line is below 20, the asset is considered to be oversold and is overbought when it is above 80. Oversold or overbought conditions in these cases are not an invitation to buy as a strong trend both bullish or bearish may lead to sideways price consolidation for a long time.
When the %K line crosses over the %D, the current trend is higher than the 3-period average which means that a bullish trend is forming as the price tends to follow momentum as shown by the crossing over of the plot signals.
Just like oversold or overbought conditions do not signal to buy or sell, any time the indicator’s value drops below 80, it is not the time to sell as this can happen because of sideways consolidation rather than a trend reversal. It only means that the upward momentum has stalled for the time being.
7. Ichimoku Cloud
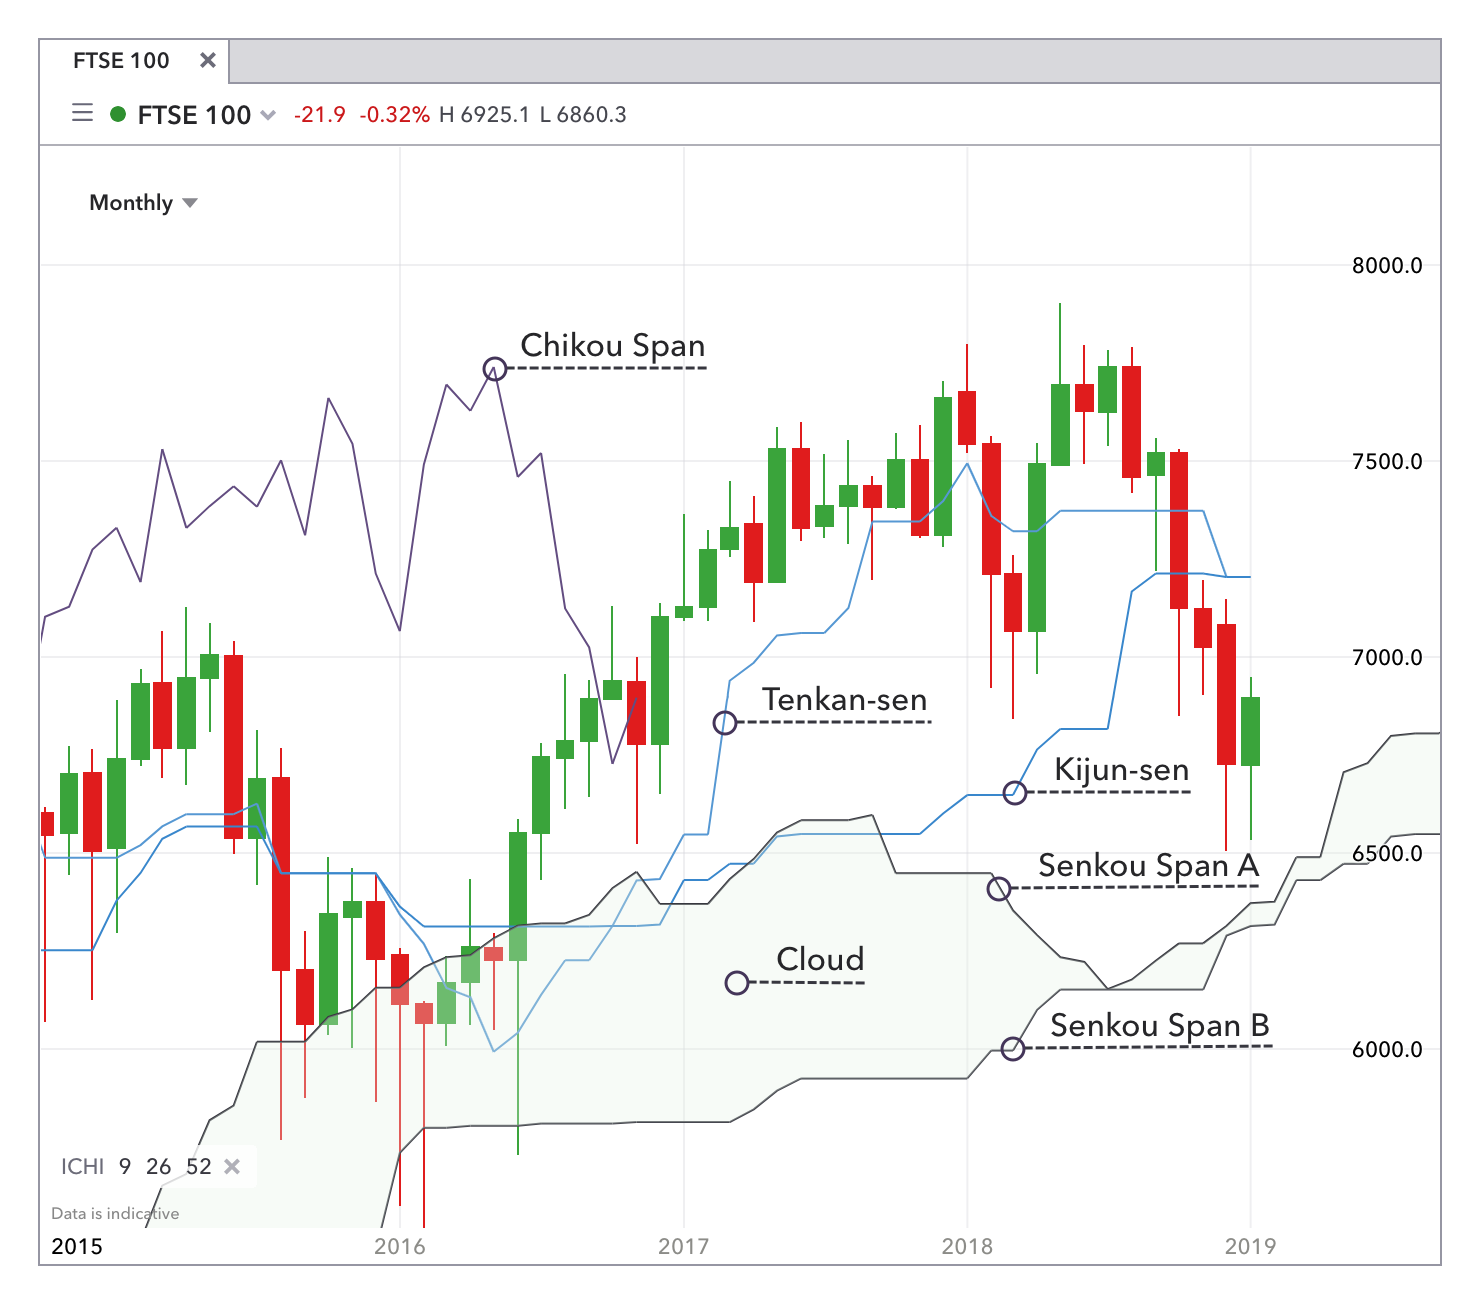
The Ichimoku Cloud is a combination of a few technical analysis indicators that provides support and resistance levels that can help a trader make trades according to the market’s strength and direction.
The other name for the indicator is Ichimoku Kinko Hyo and was first devised by a Japanese journalist in the 1960s and is composed of five components namely the Tenkan-sen (Conversion line), Kijun-sen (Base Line), Chikou (Lagging Span Line), Senkou A (Leading Span A), and Senkou B (Leading Span B).
The ‘cloud’ is formed by the crossing over of Senkou A and B and if the price is above the cloud, the trend is bullish and similarly, if the price is below the cloud, the price is in a downtrend.
When Senkou A is below Senkou B, it is shown on the chart with a red cloud which means that the market is set for a downturn. When the cloud is green, (Senkou A is above Senkou B) it means the asset is gaining upward momentum.
Day traders tend to use the edge-to-edge cloud setup quite frequently where if the price enters the cloud, it tends to go to the other edge before either reversing or continuing its journey. When the price breaks above or under the cloud, it signifies a trend reversal that traders can take advantage of.
Beginner traders might be overwhelmed by the amount of information presented by the indicator, it should be viewed as a combination of multiple existing technical indicators and not simple ones like the moving average indicator.
8. On Balance Volume (OBV)
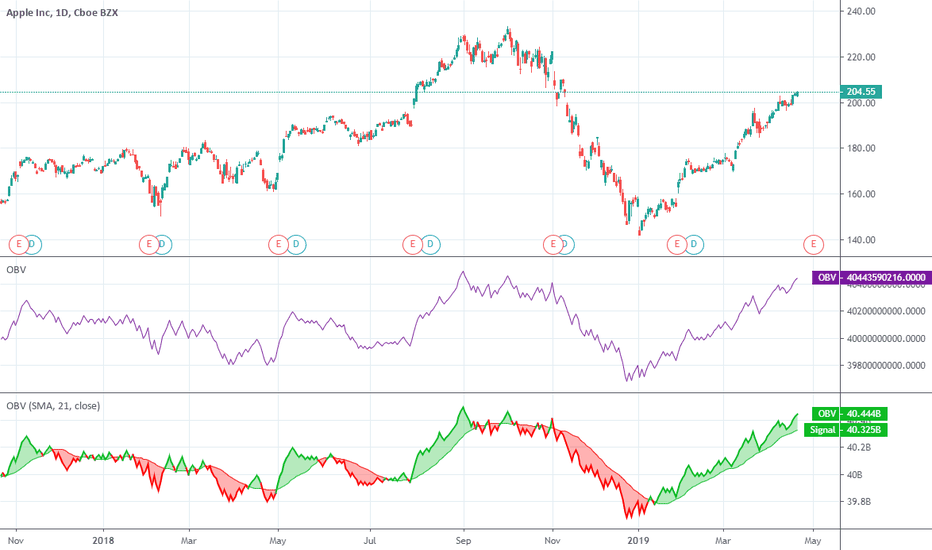
On Balance Volume is one of the technical indicators that use the volume data of the asset in question to predict which way the price will go and to profit off of the movement. In technical analysis, OBV is also referred to as a cumulative indicator as the day’s volume is added to the total OBV if the price closes up at the end of the day.
If the price closes down, the day’s volume is subtracted from the OBV total, and no calculations are made if the day ends flat. In this way, OBV can help to predict the long-term price momentum of an asset.
An increase in OBV means that there are market participants that are still willing to purchase at the current price, and a decreasing OBV will tell you that the selling pressure of the asset is high.
With this, you can figure out which of the cryptocurrencies are popular and as the market is made up of both buyers and sellers, OBV helps to find and trade the popular ones so that there is more liquidity. Higher the OBV, the higher and more reliable the currency is in this market where there are multiple new currencies every day.
Starting with Futures Trading? Know the difference between Cryptocurrency Futures and Options contracts
FAQs:
- Are there indicators for crypto?
Some of the best technical analysis indicators are now the best indicators for cryptocurrency trading as well. Everything from Moving Average Convergence Divergence (MACD), to the RSI indicator, and the Bollinger Bands were used to trade the legacy equity markets but are all now used to trade crypto and for price predictions.
The best technical indicators are generally used in conjunction with other indicators to have multiple inputs confirm the direction an asset is about to take. Once you have a clear trading signal, you can be confident in your decision, and take the appropriate position.
- Is MACD a good indicator for crypto?
It can’t be said with surety that the MACD indicator is a good indicator for crypto but it is sure that it is used by a lot of traders to devise their trading strategy. This is part of the reason that the best indicators give the best signals, as they are used by a majority of traders with the same settings.
Momentum is an important concept in both crypto and regular equity markets and the MACD signal line does a good job of incorporating it into the indicator itself. So when the momentum is increasing either in the upward or downward direction, that is a signal to traders that a trend is emerging and they may choose to take advantage of it if supported by the other indicators.
- Which indicator is best for BTC?
There is no one indicator that will work the best if you are looking to trade bitcoin. You should ideally pick out of the indicators mentioned above and use more than one to make sure that your confidence in your trading decision is high.
Going from simple indicators like RSI to something a little advanced like the Ichimoku cloud or the MYC trading indicator will cause you to receive a variety of information that you can use to decide the perfect entry and direction of your trade.
Conclusion
Again, there is no simple and single answer to this question. Technical analysis and technical indicators both rely on past records and the fact that a lot of traders use the same indicators with the same settings.
You can use Bollinger Bands which shows a channel of expected volatility in price where the middle channel is by default the 20-day moving average of the selected period, and the upper and lower bands are two standard deviations in either direction of the middle channel.
Also, to master these trading indicators you can use crypto trading demo accounts to practice.