Open Interest, also referred to as OI, is a straightforward metric, and it shows the total volume of open contracts being traded at that time. This number keeps changing as the day progresses as contracts are bought and sold.
This can be used as a measure of liquidity in the market at the moment. When the Open Interest is high, the market has a large number of open contracts. Seasoned traders know this is when the market is ripe for trading.
OI gets confused with volume sometimes, but volume represents the number of contracts actually traded in the market, whereas OI represents the number of contracts that are open at the time.
This article takes you through how you can use OI to trade and its correlation with price.
Why Does Open Interest Matter In Crypto?
With a complete analysis of the OI of each asset in the market, seasoned traders can tell which crypto tokens the market favours.
OI is one of the most important indicators of the health of the options market for an asset. Again, if there are high levels of Open Interest, it indicates that there are a large number of options available to trade.
This means that the market also has a large amount of liquidity. On the other hand, low levels of Open Interest indicate that only some options are in the market and can be traded. This means that there is a low level of liquidity for the asset you are looking to trade.
If you are a good trader, you would use Open Interest in conjunction with the price of an options contract which helps you to calculate the profits you can generate from an Options trade.
When you talk about legacy financial markets, regular traders keep an eye on small changes in open interest. This helps them to pinpoint whether the price trend and market sentiment have some strength to them or not.
Put simply; Open Interest indicates whether capital is coming in or going out of the market. If more money goes into Ethereum Futures, OI increases, but if capital goes out of the market, OI will decrease.
So you can use the increasing OI to indicate that a bull market is coming up, but a steady decline means that the bear market might be approaching.
A high Open Interest is a signal to traders that the market is about to make a large move in either direction in the near future.
When you look at a Futures or Options quote, this is shown right next to the price, and volume can help you take a better decision regarding which direction you should trade-in.
Correlation Of Open Interest & Asset Price
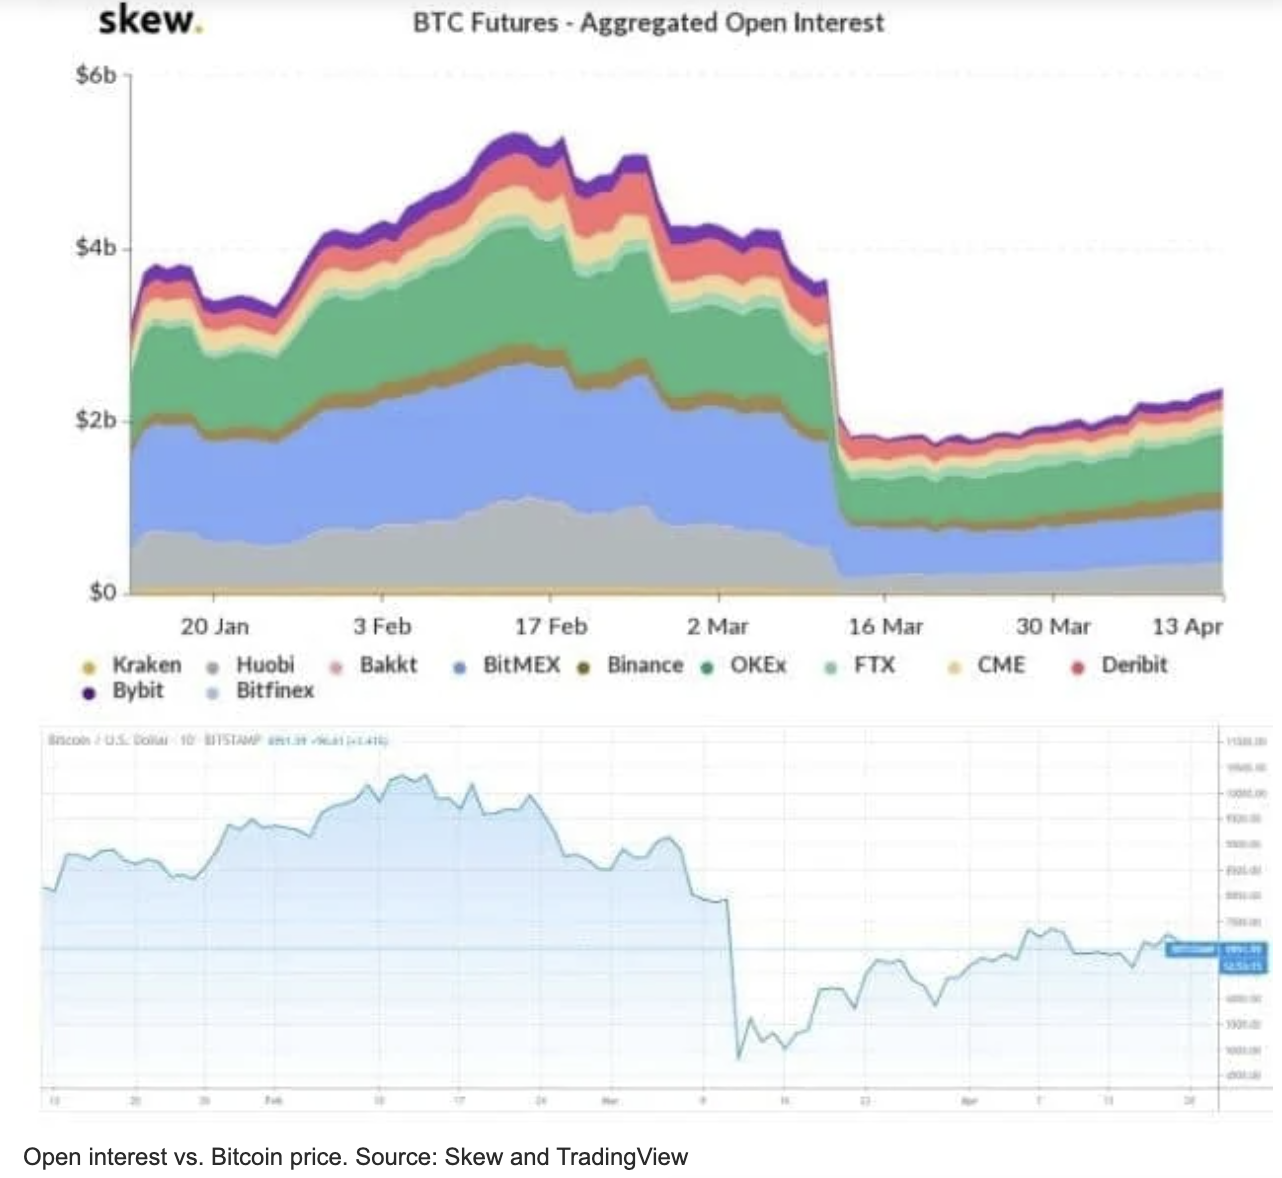
If you look closely at the historical price of Bitcoin and its Open Interest, they have a positive correlation.
As per data gathering websites like Skew, Bitcoin’s price moves with its OI both on the way up and on the way down.
Take, for example, Bitcoin’s price dump on March 12th, 2020, which the market attributed to the Covid pandemic; the value of Bitcoin fell by nearly 40%. This was preceded by a sharp decline in Open Interest in the major exchanges.
A simple explanation for this could be the liquidation of long positions that a lot of traders would have had open.
In volatile times like these, the price of Bitcoin tends to form price wicks that aim to grab more liquidity from the market.
When contracts are liquidated and closed, this reduces the Open Interest in the market.
So, there is a positive correlation between the market price and Open Interest.
This understanding can be combined with the market sentiment, trading volume, and market structure in order to decide the direction of your trade.
How Is Open Interest calculated?
Open Interest is calculated as the monetary value of contracts that are currently held open by investors in the selected period of time. What is not counted in this value is the number of contracts that have been closed by their holders.
Let’s try to understand this with an example:
Take a buyer and seller who trade a contract, and both of them take either side of the trade. The traded quantity is 20 BTC at a strike price of $17,200.
Once this contract is fixed and agreed upon, it will increase the OI by $17,200 * 20 = $344,000.
Now the buyer has two options for what to do with the contract. They can either sell the contract to another buyer or close the contract and settle the profit/loss monetarily.
If the buyer chooses to sell it to another interested trader, the OI will remain unchanged as the contract is still open. OI will only increase when a new contract enters the market or decrease when a contract is closed.
This makes OI a very informative indicator for both the Futures and Options markets, as a trader can take a glance at it and tell whether a market’s interest in a particular asset is worth trading or not.
Seasoned traders also use it to tell which of the assets are over or undervalued, and this means there is an opportunity to make money.
The trade, in this case, can be taken in either direction depending on whether your analysis tells you that the contract is over or undervalued.
Open Interest in Futures Markets vs Options Markets
Open Interest is comparatively more useful in the Futures markets than in the Options markets. Some Options traders don’t even pay attention to it as it is not a true indicator of whether options were bought or sold.
Even though OI by itself does not give reliable information in the Options trades, it can be used in coordination with traded volume and whether the market structure is bullish or bearish. Together, these indicators can help you take a better-informed Options trade.
In cases when the traded volume of an asset is higher than the OI, you can understand that the trading was exceptionally high on the day or the time frame. The OI also gives traders an idea of how good the asset’s liquidity is in the Options market.
If it wasn’t for the existence of OI, Options contracts would not have a secondary market, as no trader wants to be stuck with an illiquid contract that none of the market participants is interested in trading.
When the OI is high for an asset, it shows that its Options contracts are easier to trade at a spread between the bid and ask prices.
If you want to enter and exit the markets at the most opportune times, you need to use OI with volume metrics.
Consider a crypto futures platform for Bitcoin (BTCUSDT perpetual) like Binance or Bybit-like Exchange where four traders are placing their trades.
Also, check out Binance Review here for more info !!
We can see how their trades affect the OI metric.
| Trader | Trade direction | Trade Status | Quantity | Change in OI | Cumulative OI |
| 1 | Long | Open | 9 BTC | +9 | 9 |
| 2 | Long | Open | 10 BTC | +10 | 19 |
| 3 | Short | Open | 4 BTC | +4 | 23 |
| 4 | Short | Close | 7 BTC | -7 | 16 |
As the above table makes clear, even when a short position is opened on a crypto exchange that allows shorting, the quantity is added to the OI metric, and it only reduces when a position is closed.
Conclusion
As most analysts are looking at the markets and trading them on a day-to-day basis, if you can extract information from the OI, volume, and price metrics, you will get multiple opportunities to take winning trades.
When OI is increasing together with the price and volume, it could be an indication of an upcoming bull trend.
In the same way, you can identify when a bear trend is about to begin. You can modify your trading strategies accordingly.
Specifically for Bitcoin Futures, a falling OI will tell traders that traders are looking to pull out their capital from the market.
This will mean that the market will be comparatively less liquid, so it might not be the best time to trade on short side, either.